1. Methodologies and Sources | Fear and Greed Index
In the first part of the article, we will explore the methodology behind designing a Fear and Greed Index, from conceptualization and mathematical techniques to data gathering, as we quantify market sentiment in real time.
Feb 24, 2025 · Rian Yan
Understanding the concept of CNN's Fear and Greed Index
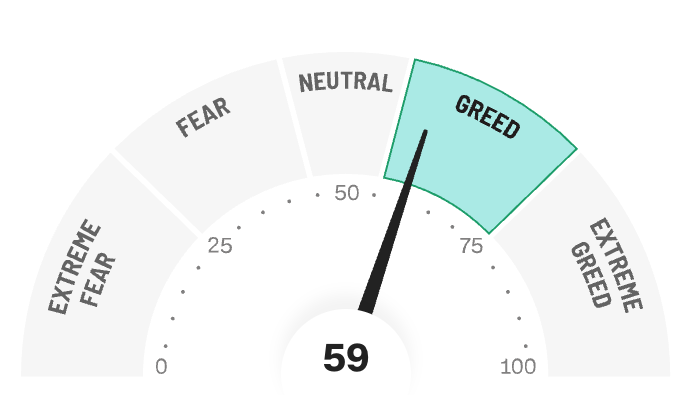
The Fear and Greed Index, popularized by CNN (CNN Money), is a tool that measures investor sentiment to help gauge overall market conditions. It's built on the notion that excessive fear often drives asset prices down, while excessive greed can inflate them, potentially creating bubbles. The index combines seven market indicators, each contributing to a composite score ranging from 0 to 100. Lower scores indicate extreme fear, while higher scores reflect extreme greed.
The seven components of the index cover key areas of the market:
- Stock Price Momentum: looks at the S&P 500's movement relative to its 125-day average, showing bullish or bearish trends.
- Stock Price Strength: examines the number of stocks reaching 52-week highs versus lows, while Stock Price Breadth measures market volume, indicating the level of participation in market moves.
- Put and Call Ratio: assess sentiment by analyzing the trading volume of options for buying versus those for selling.
- Market Volatility: represented by the VIX Index, reflects uncertainty or stability in the market.
- Safe Haven Demand: compares stock performance with that of bonds, a safe haven asset, to indicate risk appetite.
- Junk Bond Demand: examines the difference between junk bonds and safer government bonds, with narrower spreads indicating greed and wider spreads indicating fear.
Each of these components is given a score from 0 to 100, and the total score offers a snapshot of the market's emotional state. For investors, the Fear and Greed Index can serve as a valuable tool for identifying potential turning points. Extreme fear may signal a buying opportunity as prices drop, while extreme greed could suggest caution, as markets might be overextended. By tracking sentiment, the Fear and Greed Index acts as a useful complement to fundamental and technical analysis, offering an additional layer for assessing market risks and opportunities.
Developing the Index for the Indonesian Stock Market
Inspired by CNN's methodology, our objective is to develop a Fear and Greed Index specifically tailored to the Indonesian stock market. This index will rely on relevant data and indicators that effectively capture the unique dynamics of Indonesia's financial environment. While CNN's index provides a broad view of global market sentiment, adapting it for Indonesia will allow us to incorporate local factors that influence market behavior, especially those related to regional economic conditions and investor psychology. In particular, adding macroeconomic indicators such as interest rates, exchange rates, and the Buffett Indicator offers insights into the market's sensitivity to broader economic shifts. These additional factors are essential for accurately gauging sentiment in a developing economy, where external economic influences can have pronounced effects on local market sentiment.
Data availability is a key consideration in defining this index. For instance, while put and call ratios are integral to CNN's index, the Indonesian stock market lacks sufficient options trading volume and reporting standards for these metrics. As a result, we'll focus on accessible, high-impact indicators that offer direct and indirect measures of investor sentiment.
Direct Indicators of Stock Market Sentiment:
- Market Momentum: IDX Composite momentum, capturing broader market direction.
- Stock Price Strength: Proportion of stocks hitting new highs versus lows.
- Volatility: Measuring market stability or uncertainty.
- Volume Breadth: Reflecting the level of participation across trades.
- Safe Haven Demand: Balance between equity and bond demand, indicating risk appetite.
Indirect Indicators of Macroeconomic Influence:
- Exchange Rate: Impact of currency stability on investor confidence.
- Interest Rate: Reflects the cost of capital and economic health.
- Buffett Indicator: Market cap-to-GDP ratio, providing a valuation benchmark for market sentiment.
Together, these indicators will offer a comprehensive, data-driven view of sentiment in the Indonesian stock market, enabling more informed analysis and potentially predictive insights.
Establishing the Mathematical Methodology
To create an effective Fear and Greed Index tailored for the Indonesian stock market, we first define the relevant indices and then outline a clear mathematical methodology. Each individual index, such as market momentum or volatility, will have its own Fear and Greed score. These scores are then combined to create a comprehensive sentiment measure for the overall market.
Step 1: Understanding Simple Moving Average Method (SMA)
The Simple Moving Average (SMA) method is a valuable tool in constructing a Fear and Greed Index as it smooths out short-term fluctuations, revealing overall trends. By averaging the last N (as you define) data points, SMA helps to reduce market noise, making it easier to detect real shifts in sentiment rather than reacting to daily volatility. This approach is adaptable to different types of data: for example, in market momentum, SMA is applied to stock closing prices, while in volatility, it may be calculated using daily changes in price or index values. For our purposes, we chose a 7-day SMA to capture market trends without overemphasizing daily fluctuations. This period balances responsiveness with trend stability and provides insight into sentiment shifts over a manageable short-term period. By consistently applying a 7-day average, we can more accurately gauge investor sentiment changes in the Indonesian market within a week's context, enabling us to maintain sensitivity to recent market behavior.
Step 2: Calculating Distance from SMA
In this step, we calculate the distance from the SMA based on the percentage change of each indicator rather than using absolute values. This approach standardizes the data, making it easier to interpret relative deviations across different indicators.
For each indicator, the daily percentage change is firstly calculated, and then the SMA is applied to these percentage changes over a selected period - 7 days. The distance between the current daily percentage change and the SMA reflects the strength of deviation, with larger positive values indicating heightened “greed” and larger negative values indicating “fear.”
Step 3: Scaling the Distance to a 0-100 Fear and Greed Index
Now that we have calculated the percentage change for each indicator, the next step is to normalize these values to fit within a 0-100 scale. This step, known as min-max scaling, ensures that each indicator aligns with the Fear and Greed Index structure, where 0 represents extreme fear and 100 represents extreme greed.
This formula takes the current value and scales it based on its position between the predefined minimum and maximum. Any values below the minimum threshold are clipped to 0, and any values above the maximum are clipped to 100. This ensures that the indicator always falls within the 0-100 Fear and Greed range.
Step 4: Modelling the Final Fear and Greed Index
Ultimately, we will obtain the daily scaled Fear and Greed Index for each selected indicator. These individual indices will then be combined using unsupervised machine learning models to determine the weight of each indicator, resulting in the overall Fear and Greed Index for the Indonesian market.
Note that in our methodology, the SMA calculation often uses percentage-based scaling, so the min-max scaling should apply to these percentage values. However, for some indicators, rather than using percentage changes from the SMA, we may simply calculate the absolute distance from the SMA and scale this using relative min and max values. The next article in this series will dive deeper into the specific calculations for each index as well as unsupervised machine learning modelling.
Data Sources for Calculating Sentiment Indices
Step 1: Identify Input Data Sources
To begin, we will gather the necessary input data required to calculate each of the predefined indices. Below is an overview of the key data points needed for these calculations:
Direct Indicators of Stock Market Sentiment:
- Market Momentum: daily stock prices changes for IDX composite
- Stock Price Strength: daily closing prices of individual stocks within the IDX Composite
- Volatility: daily closing prices of the IDX Composite
- Volume Breadth: daily trading volume data for stocks in the IDX Composite.
- Safe Haven Demand: 10 year indonesian government bond daily rate & Indonesian stock market capitalization
Indirect Indicators of Macroeconomic Influence:
- Exchange Rate: daily exchange rate of the Indonesian Rupiah (IDR) to the US Dollar (USD), issued by Bank Indonesia (the central bank)
- Interest Rate: daily interest rate or central bank policy rate issued by Bank Indonesia
- Buffett Indicator: market capitalization of the IDX Composite and Indonesia's GDP
To gather the necessary data for calculating our predefined indices, we categorize the data sources into two main groups:
- Internal Data Sources (via Sectors Financial API)
- Daily Stock Closing Price for IDX Composite: Used to calculate Market Momentum, Price Strength, and Volatility indices.
- Daily Stock Trading Volume for IDX Composite: Utilized in calculating the Volume Breadth index.
- Daily Stock Market Capitalization: Essential for the Buffett Indicator, allowing us to compute market cap-to-GDP ratios.
- External Data Sources (via Web Scraping)
- Interest Rate: The daily interest rate issued by the Indonesian central bank (Bank Indonesia), used as an indicator of macroeconomic sentiment.
- Exchange Rate: The daily IDR-to-USD exchange rate from the Indonesian central bank, which reflects economic stability.
- 10-Year Indonesian Government Bonds: Yield data for 10-year government bonds, representing a benchmark for Safe Haven Demand in the market.
Data from external sources are linked above. In the next step, we will utilize Sectors Financial API to retrieve data from internal sources.
Step 2: Gathering Input Data from Sectors Financial API
Sectors Financial API offers comprehensive insights into the Indonesian stock market, allowing us to efficiently access the data needed for our analysis. First we use the company API to rend the company information to identify the stock tickers.
We will see the result of a list of response below.
We will now use the “Daily Transaction Data” API and create a function that loops through company tickers to retrieve the historical market data for the IDX Composite.
Now if we check the result historical IDX30 data, we will have all the information we need.
Step 3 Scraping External Data and Storing inside database
External data sources are scraped using the BeautifulSoup library, with a GitHub Actions workflow set up to automate this process daily. This automation retrieves daily values for the interest rate, exchange rate, and 10-year Indonesian government bond rate. Since the interest rate is updated monthly, we interpolate it to a daily frequency by filling each day within the same month with the same rate.
The backend data pipeline setup will be discussed in detail in a separate article.
With the methodology, calculations, and data sourcing now complete, we are ready to proceed to the next part of this article, where we will begin computing the indices.
Further reading
Read More
2. Calculations and Modelling | Fear and Greed Index
In the second part of this article, we will walk through the calculations for each individual index and discuss the modeling approach for deriving the final Fear and Greed Index for the Indonesian stock market.
3. Data Engineering | Fear and Greed Index
In the third part of this article, we will walk through the data handling process - from sourcing into production-ready data.
Tags: market-sentiment, fear-and-greed