2. Calculations and Modelling | Fear and Greed Index
In the second part of this article, we will walk through the calculations for each individual index and discuss the modeling approach for deriving the final Fear and Greed Index for the Indonesian stock market.
Feb 24, 2025 · Rian Yan
In the first part of this article, we examined the concept of the Fear and Greed Index, its mathematical foundation, and the data collection process using Sectors Financial API. We identified eight indices—comprising both direct stock market indicators and indirect macroeconomic factors—that contribute to the overall sentiment index for the Indonesian stock market. With the data now organized into dataframes, we are ready to proceed with calculating each individual index. In this article, we will compute these indices and explore the final model for the overall Fear and Greed Index using a weighted average approach. Note that calculations involving external data sources are based on saved CSV files; the backend data processing pipeline will be covered in a separate article.
Market Momentum Index - IDX Composite Momentum
The Market Momentum Index measures the strength and direction of recent price movements in a stock market, indicating whether the market is trending upward or downward. It's typically calculated using the rate of change in an index or stock prices over a set period, such as the difference in the IDX Composite over the past week or month. In the context of the Fear and Greed Index, high market momentum reflects investor optimism or “greed,” while negative or weak momentum signals caution or “fear” among investors, as it suggests a potential market downturn.
From the code above we will have the result of daily market momentum fear and greed index and we can easily access today's market momentum fear and greed index through the iloc function.
We can plot the results using 50 as a threshold: values below 50 indicate fear, while values above 50 signify greed. Here we will show the visualization using market momentum index result as an example. The techniques to plot rest of the index is the same.

Stock Price Strength
The Stock Price Strength Index reflects the proportion of stocks trading above their moving averages, such as the 50-day or 200-day average, indicating the overall health of the market. It's calculated by dividing the number of stocks above their moving average by the total number of stocks in the index. In the context of the Fear and Greed Index, a high price strength suggests optimism or “greed” as more stocks are performing well, while a low value indicates “fear”, showing that a majority of stocks are trending downward.
After running this code, we should see this result below.
Stock Price Strength
The Volatility Index measures the degree of variation in stock prices over a specified period, often using the standard deviation of daily returns to quantify market uncertainty. It's calculated by analyzing recent price fluctuations, typically over the past 30 days. In the context of the Fear and Greed Index, high volatility reflects “fear” as investors react unpredictably, while low volatility suggests “greed,” indicating a stable or confident market sentiment.
Upon running the code above, we will see this result.
Volume Breadth
The Volume Breadth Index assesses the strength of market participation by comparing the trading volume of advancing stocks to that of declining stocks. It's calculated by taking the difference between the volume of advancing and declining stocks, often expressed as a ratio or percentage. In the context of the Fear and Greed Index, high volume breadth reflects “greed,” showing broad investor confidence, while low or negative volume breadth indicates “fear,” as fewer stocks experience strong trading activity.
After running this code, we will see this result below.
Different from visualizing with only the matplotlib library, here we used seaborn to create a clean, grid-style background with sns.set(style="whitegrid"), which enhances readability and presentation. This approach helps to visually separate the “Fear” and “Greed” zones with shaded areas, making the sentiment shifts in the Volume Breadth Index easier to interpret.

Safe Heaven Demand
The Safe Haven Demand Index measures investors' preference for safer assets, like gold or government bonds, over stocks, indicating risk aversion. It's calculated by tracking the price changes or trading volumes of these safe-haven assets compared to the broader stock market. In the context of the Fear and Greed Index, high demand for safe havens reflects “fear,” as investors shift away from stocks, while low demand suggests “greed,” indicating a stronger appetite for risk and confidence in the market.
The code outputs a dataframe that contains the average stock return, government bond rate, and the scaled Safe Haven Demand Index.
Exchange Rate and Interest Rate
The Exchange Rate measures the relative strength of the Indonesian Rupiah (IDR) against foreign currencies, particularly the US Dollar (USD), providing insights into economic stability and investor confidence. It's calculated by tracking daily fluctuations in the IDR-USD exchange rate. In the context of the Fear and Greed Index, a weakening IDR indicates “fear,” as investors may perceive increased economic risk, while a strengthening IDR suggests “greed,” reflecting economic stability and greater confidence in the market.
The Interest Rate reflects the central bank's monetary policy stance and its influence on borrowing costs, economic growth, and inflation. It's measured by tracking the daily policy rate set by Bank Indonesia. In the Fear and Greed Index, higher interest rates signal “fear,” as increased borrowing costs can dampen economic growth and market optimism. Conversely, lower interest rates reflect “greed,” encouraging investment and boosting confidence in the stock market.
To engineer the Fear and Greed Index for both Exchange Rate and Interest Rate, we analyze their trends over a fixed period by examining percentage changes that signal shifts in investor sentiment. For the exchange rate, we calculate the percentage change in the IDR-USD rate over time, with a weakening IDR suggesting “fear” and a strengthening IDR indicating “greed.” For the interest rate, which is typically issued monthly, we transform it into daily data by assigning the same rate for each day within the month. A rise in interest rates reflects “fear,” as higher borrowing costs can impact economic growth, while a decrease signals “greed,” encouraging investment. Both indicators are then scaled to a standardized 0-100 range for integration into the overall Fear and Greed Index, contributing to a comprehensive measure of investor sentiment.
Here is an example using exchange rate.
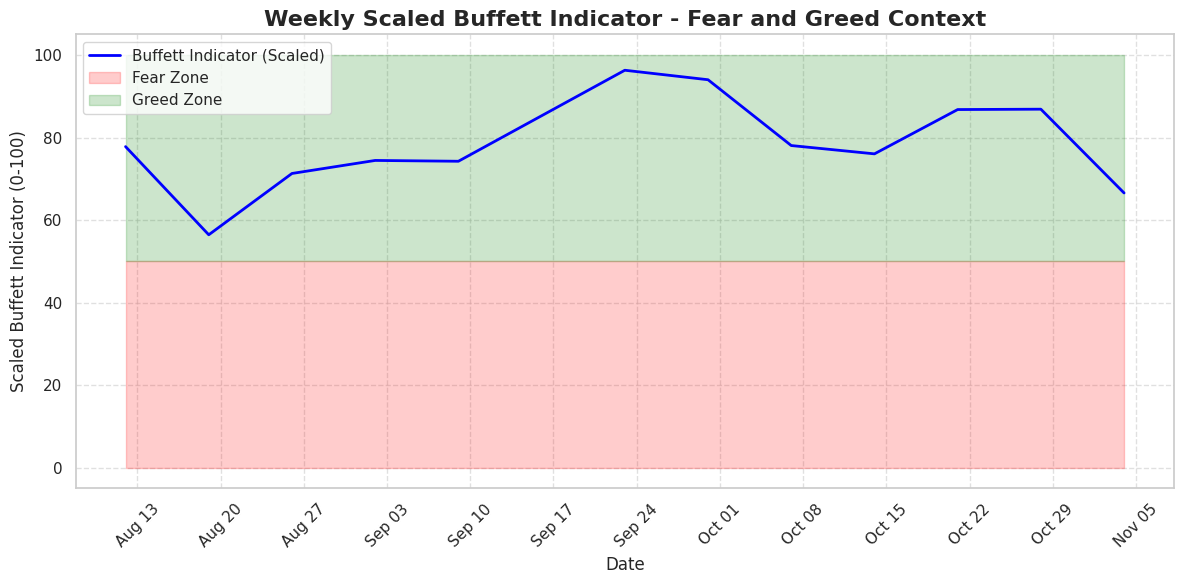
Buffett Indicator
To engineer the Fear and Greed Index for the Buffett Indicator, we calculate the Buffett Indicator as the ratio of the stock market's total market capitalization to Indonesia's GDP, a commonly used measure to assess market valuation relative to the overall economy. A high Buffett Indicator suggests that the market is overvalued compared to economic output, signaling “fear” due to increased caution and risk of a potential correction. Conversely, a low Buffett Indicator implies the market is undervalued, indicating “greed” as stocks appear favorable relative to economic fundamentals. Since GDP is typically reported quarterly, we convert it to a daily measure by carrying forward the latest GDP figure until the next release, using Indonesia's projected 2024 GDP of $1.49 trillion as a baseline. The Buffett Indicator ratio is then normalized to a 0-100 scale to align with the broader Fear and Greed Index, ensuring it accurately contributes to the overall sentiment measure.
The result buffett indicator fear and greed index will look like this below.
Modelling for Final Indonesian Fear and Greed Index
Now that we have calculated all eight individual indices for the Fear and Greed Index, we have consolidated these results into a single dataframe, allowing us to model the final combined index. Our goal is to determine the weight or contribution of each index to the overall sentiment score, capturing both explicit contributions and any latent patterns among the indices. By identifying these weights, we aim to quantify how each index—such as market momentum, exchange rate, or safe haven demand—uniquely influences the Indonesian stock market's sentiment landscape. This modeling step is critical to ensure that the final Fear and Greed Index accurately reflects the combined impact of diverse economic and market indicators.
Given the absence of a pre-defined “ground truth” for an overall fear and greed score, we employ unsupervised learning to explore and derive these patterns without labeled data. Unsupervised methods like PCA, ICA, and Factor Analysis are well-suited for this problem, as they allow us to capture the underlying structure and relationships among the indices. PCA helps to maximize variance, revealing the most significant contributors and reducing dimensionality without losing essential information. ICA, in contrast, emphasizes statistical independence, which can be valuable if each index captures distinct sentiment drivers. Factor Analysis, meanwhile, identifies latent factors, assuming correlations among indices that reflect broader, shared sentiment influences. By applying these methods, we can construct a well-rounded and empirically-based Fear and Greed Index, balancing variance, independence, and latent factors.
Principal Component Analysis
We will see below how each component contributes to the variance.
Next, we will get the loadings and calculate the absolute contributions and normalize them to get percentage.
PCA suggests that the price strength, market momentum, and volume breadth indices are the primary contributors, collectively explaining over 70% of the variance. This indicates that market performance indicators are the most significant drivers of sentiment in the Fear and Greed Index. Exchange rate and buffett indicator contribute moderately, with the smallest contributions from interest rate, safe haven demand, and volatility. This distribution implies that macroeconomic factors like interest rates and volatility are less central to market sentiment under this method, making PCA suitable if the goal is to capture variance driven primarily by direct market indicators.
Independent Component Analysis
ICA highlights price strength (35%) and market momentum (29%) as the most independent drivers of sentiment, with buffett indicator and volume breadth also playing moderate roles. However, exchange rate, volatility, and interest rate contribute minimally, showing that they provide little unique, independent information for sentiment. ICA's emphasis on price strength and market momentum suggests that these indices capture distinct, non-overlapping signals that directly impact investor sentiment. ICA is advantageous if we prioritize unique, independent indicators of fear and greed, as it filters out redundancy.
Factor Analysis
Factor Analysis provides a balanced view, revealing that price strength, market momentum, and volume breadth are also the dominant components in the primary latent factor (Factor 1). However, exchange rate and buffett indicator contribute more here than in PCA or ICA, suggesting that these indices are part of a correlated sentiment factor that includes macroeconomic stability indicators. Volatility also emerges as significant in a secondary factor, indicating a separate dimension of risk sentiment. Factor Analysis thus implies that sentiment is multifaceted, with broader market indicators driving one aspect and macroeconomic factors influencing another, more risk-oriented dimension.
Final Decision
In conclusion, after comparing the results of the PCA, ICA, and Factor Analysis models, the final decision is to use the mean of the three sets of weights as the basis for constructing the overall Fear and Greed Index for the Indonesian stock market. This approach balances the distinct insights each model offers, combining variance maximization, independence detection, and latent factor representation to create a more comprehensive sentiment index.
Each model provides unique advantages. PCA highlights the indices that explain the most variance in the data, underscoring the influence of indices like market momentum and exchange rate on the overall sentiment. This approach captures the dominant factors but may overlook unique contributions from less correlated indices. ICA, on the other hand, identifies independent sources of sentiment, emphasizing the influence of volume breadth and exchange rate as distinct drivers of market sentiment. While ICA offers valuable insights into independent sentiment components, it may understate the influence of interrelated factors that affect multiple indices simultaneously. Factor Analysis provides a middle ground by identifying latent factors shared among indices, showing that market momentum, price strength, and volume breadth align closely with a common sentiment factor, while volatility and interest rate represent a separate dimension of market risk.
By averaging the weights derived from these three methods, we benefit from the comprehensive view provided by PCA, the independence-focused insights of ICA, and the factor correlation perspectives of Factor Analysis. This blended approach creates a balanced and robust Fear and Greed Index that is sensitive to dominant, independent, and correlated drivers of market sentiment, ensuring that the final model is both versatile and representative of diverse market influences. Using the mean weights allows us to incorporate the strengths of each model, resulting in a more resilient and nuanced measure of sentiment for the Indonesian stock market.
Further reading
Read More
1. Methodologies and Sources | Fear and Greed Index
In the first part of the article, we will explore the methodology behind designing a Fear and Greed Index, from conceptualization and mathematical techniques to data gathering, as we quantify market sentiment in real time.
3. Data Engineering | Fear and Greed Index
In the third part of this article, we will walk through the data handling process - from sourcing into production-ready data.
Tags: market-sentiment, fear-and-greed