Building a Streaming Pipeline for Warehouse Inventory Management System
A practical demonstration on building a streaming analytics pipeline for warehouse inventory management on Google Cloud Platform.
Feb 25, 2025 · Stane Aurelius
In the current digital world, data is generated by a huge number of sources — IoT devices, sensors, applications, or even logs. It permeates all aspects of modern life, influencing the behavior of everything around us. In other words, data serves as the basis of making actions in response to an ongoing event. The main problem is that this ongoing event might become stale rather quickly, hence the reason why streaming analytics are imperative for deriving up-to-the-minute insights. Have you ever had an experience where you looked at some goods you need online and saw that it is available for sale in nearby stores, only to find it out of stock upon visiting them? This is a common case where streaming analytics is of utmost importance, highlighting a breakdown in the flow of information due to the inability to solve data timeliness challenge.
Before we dive further into streaming analytics, let's talk a little bit about traditional data solutions. Batch data processing, the legacy data processing technique, requires data to be stored in batches before being processed and analyzed. This method has become rather obsolete for a lot of business cases, as today's data can be regarded as a perpetual stream of events — the volume, velocity, and variety of incoming data keeps evolving to a higher degree. Businesses need a way to process this data in the shortest time possible to avoid the staleness problem, as well as making decisions right on time. This is where streaming analytics comes into the picture. It allows the continuous stream of data to be processed as soon as they are generated. Now, we ought not to regard streaming analytics as a new technology that magically appears out of nowhere. On the contrary, this concept has been existent for quite a long time! However, the implementation was deemed to be very difficult to the point it was not worth the effort. It is only recently has streaming analytics become easier to implement due to the rapid advancement in Cloud Computing technologies.
In this article, we will be building a resilient streaming analytics system on Google Cloud Platform. This small project aims to demonstrate how streaming analytics can be implemented to enhance the efficiency of retail warehouse management system, mimicking a real-world scenario throughout the whole process. Every data and code used in this project is available to be downloaded from GitHub.
Project Overview
This project is a work of fiction. Any names or characters, businesses or places, events or incidents, are fictitious. Any resemblance to actual businesses, or actual events is purely coincidental
SuperTech Corp is a retail company well-known for selling electronic products across Indonesia. It has built a high brand awareness over the last few years, as well as accumulating a hefty amount of revenues. The company then decides that they are ready to grow the business through market expansion, with the aim of reaching every single country in Southeast Asia starting from the neighboring countries of Indonesia.
When formulating the retail expansion strategy, SuperTech realizes a major weakness in their retail model: though SuperTech Corp offers both offline and online stores, there has not been any integration between the stores. This means that every channel through which SuperTech sells its products has its own warehouse and inventory. Now you might be thinking "What is the problem with this retail model? It provides multiple channels depending on the customers' preference nevertheless, so there should be no issue". If you give it further thought, non-integrated channels will not share their inventories with one another — then what do you think would happen if a customer tried to buy an out-of-stock product from the online channel? There are 2 possible outcomes for this case:
- The customer might be redirected to the nearby offline store to buy the product, even if the online store does not have access to the offline store's inventory data! So it might result in the customer being dissatisfied, tainting the company image and reputation.
- The online store demands the customer to wait until the product is restocked, incurring an opportunity cost for SuperTech if its other stores have some ready stocks for that particular product.
On top of the aforementioned case, non-integrated channels might also result in a channel being utterly prosperous while the others collapsed.
Considering all of the possibilities that may arise due to its current retail model, SuperTech deems the integration between channels of utmost importance. After all, a bad first impression is something SuperTech wants to completely avoid during its retail expansion. Addressing this issue, SuperTech decides to consult us (as a group of experienced data specialists) about their problems and goals. Combined with some information regarding how SuperTech currently operates their business, we then propose a solution to implement a resilient streaming analytics system with the following details:
- SuperTech owns multiple warehouses, each having the responsibilities to provide stocks for the stores in a particular area. Every collection of items is well-organized in a box within a shelf in the warehouse. The solution requires SuperTech to assign a label/tag to every box in the warehouse which contains some information regarding the product.
- Some sensors will be implemented in every warehouse for tracking product details via its tags.
- Considering that resupply was done on a daily basis, i.e. some staffs were assigned to manually check on the products' availability everyday and send the product stocks data to the purchasing team that will contact the suppliers afterwards; the sensors are set to send an update regarding the stock of each product every minute. The purpose is to allow the possibility of predictive resupply on top of solving data staleness problems.
Upon days of internal discussion, SuperTech highly anticipates the implementation of our solution. Their evaluation shows that our solution would bring plenty of benefits for their retail operation. On top of integrating their channels, our solution would also accelerate their analysis process to create timely decisions, as well as allowing the possibility of embedding AI or ML into their operational process. We are then hired to set up the sensors, set them to periodically send data, and develop the streaming analytics system.
Project Setup
For this project, you will need to clone the data and scripts from my GitHub repository. Since we do not have a real sensor for streaming the data into cloud, this project "simulates" the sensor instead. In the repository, you should see a highly-compressed sample data in the data folder containing warehouse inventory stock information. The data consists of around 16 million rows and 10 columns, with the columns being:
- timestamp: the timestamp in which the product is recorded by the sensor
- brand: product brand
- product_name: name of the product
- category: product category
- price: product price in USD
- warehouse: the warehouse name that stores the product
- supplier_id: ID of the supplier, NULL if the product is not resupplied
- stock: the number of product stocks
- defective: the number of defective stocks
- available: the number of non-defective stocks
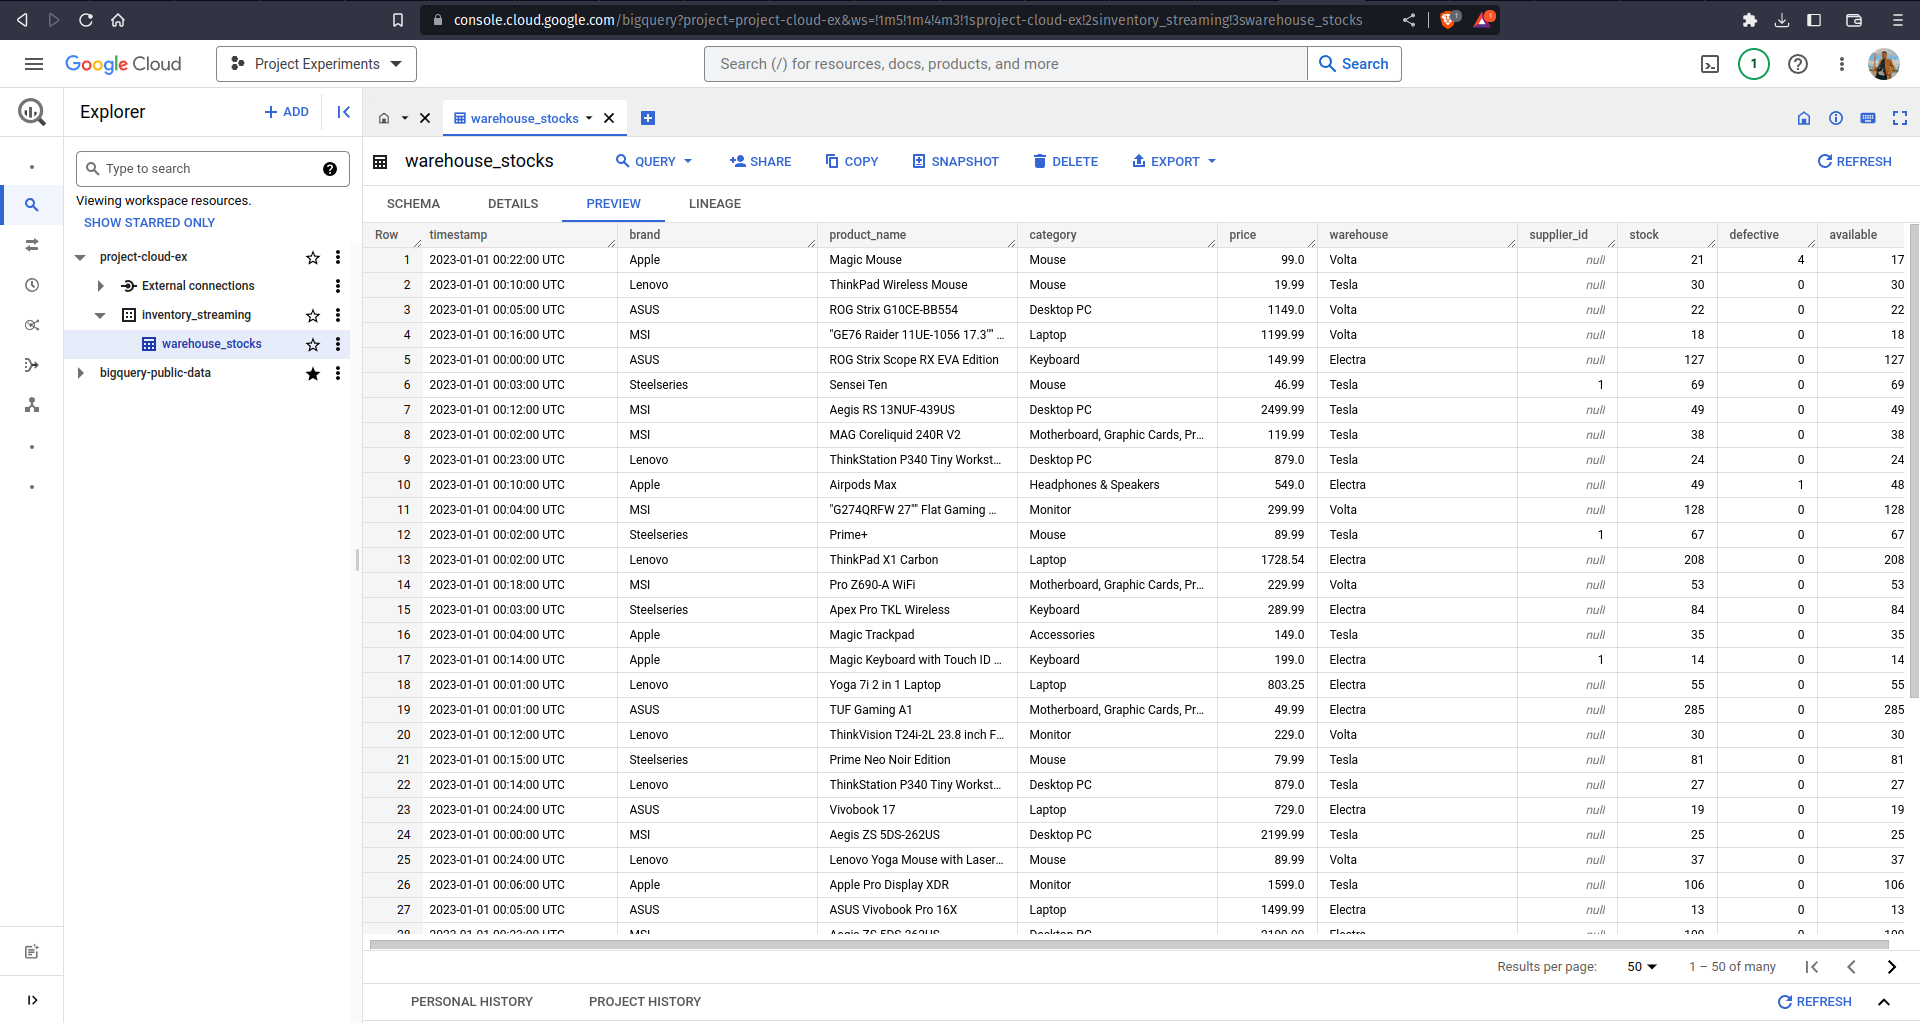
The rows in the dataset are sorted by the timestamp to simulate a sensor. Here are some of the sample rows from the dataset
This dataset is supported by the simulate_sensor.py script, which will be used for simulating a sensor by publishing the data into Google Cloud Pub/Sub. So how does this script work? The script iterates over every row in the dataset and stores the rows with the same timestamp in a list. During the process, the script also calculates how many seconds must the script sleep given a row has a different timestamp. The sleep time was calculated as the difference between the elapsed time of the simulation (calculated from the timestamp) and real-world elapsed time. See the script for more details, I added some comments that should explain what each line of code does.
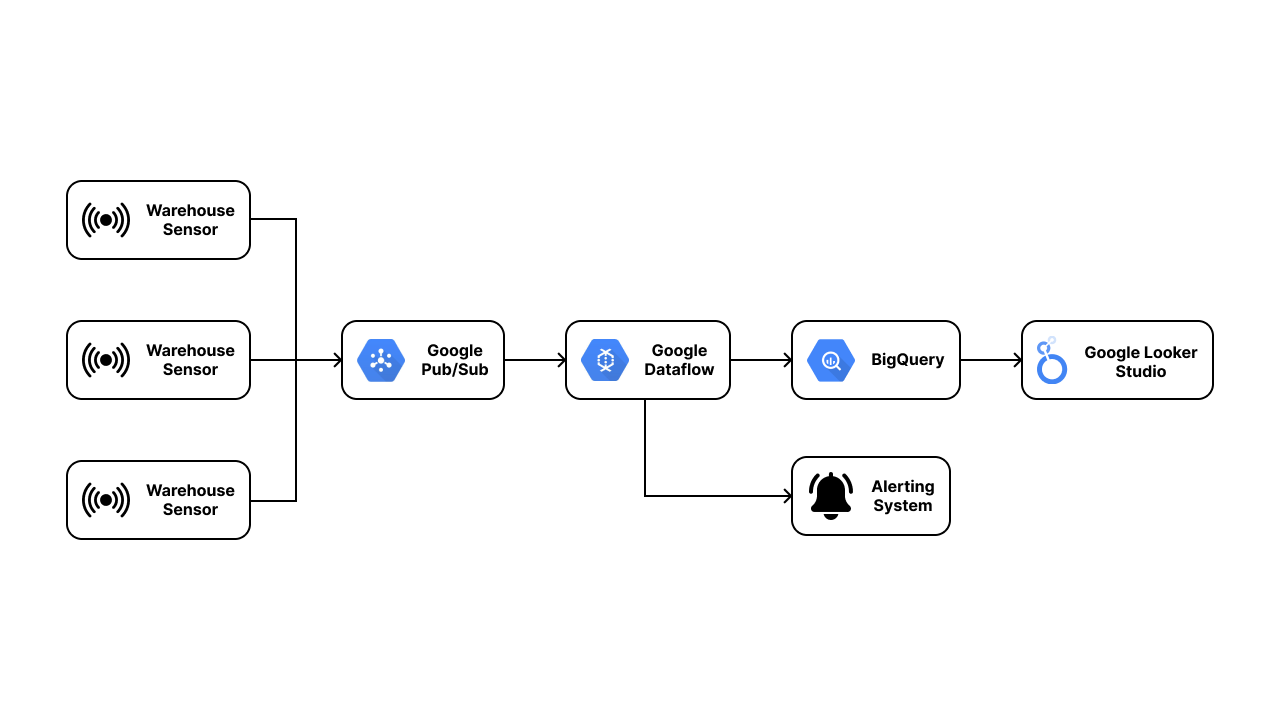
The repository also contains dataflow_pubsub_to_bq.py for creating our custom streaming pipeline. We will not dive further into this for the time being, as it will be explained in the later section of this article. For now, what you need to know is that this project's solution consists of 3 main steps:
- Integrating the sensor into Pub/Sub
- Building a custom streaming pipeline to stream the sensor data into data warehouse (BigQuery)
- Creating a real-time analytics dashboard
So what do we need to set up? The first thing you need to do is to make a virtual environment in your local machine and install the project dependencies using the following command
You also need to enable Cloud Pub/Sub API and Dataflow API in your Google Cloud Platform project. Navigate to API & Services and access the library tab. From there, you can search the APIs and enable them.
Next, create a Cloud Storage bucket in your account. Feel free to choose any name and region you prefer. Use Standard storage class and leave the rest of the configurations as is. This bucket will be used as a temporary storage when ingesting the data into BigQuery in the later section.
The last thing you need to set up is to export your Google Cloud project credentials into your local machine. This credentials will be used to allow your local machine to access the resources in your Google Cloud Platform. Navigate to IAM & Admin > Service Accounts and click on Create Service Account. Input any name you prefer for this service account and grant it the Editor and Pub/Sub Editor role.
Once the service account has been created, click on the Actions button on the right side of the service account and choose Manage Keys. Click on Create new key in JSON format and store them as credentials.json in the repository directory. The directory should now have the following structure
Make sure not to share your credentials.json, otherwise other people can access your Google Cloud project and use most of the resources freely
Integrating the Sensor Into Pub/Sub
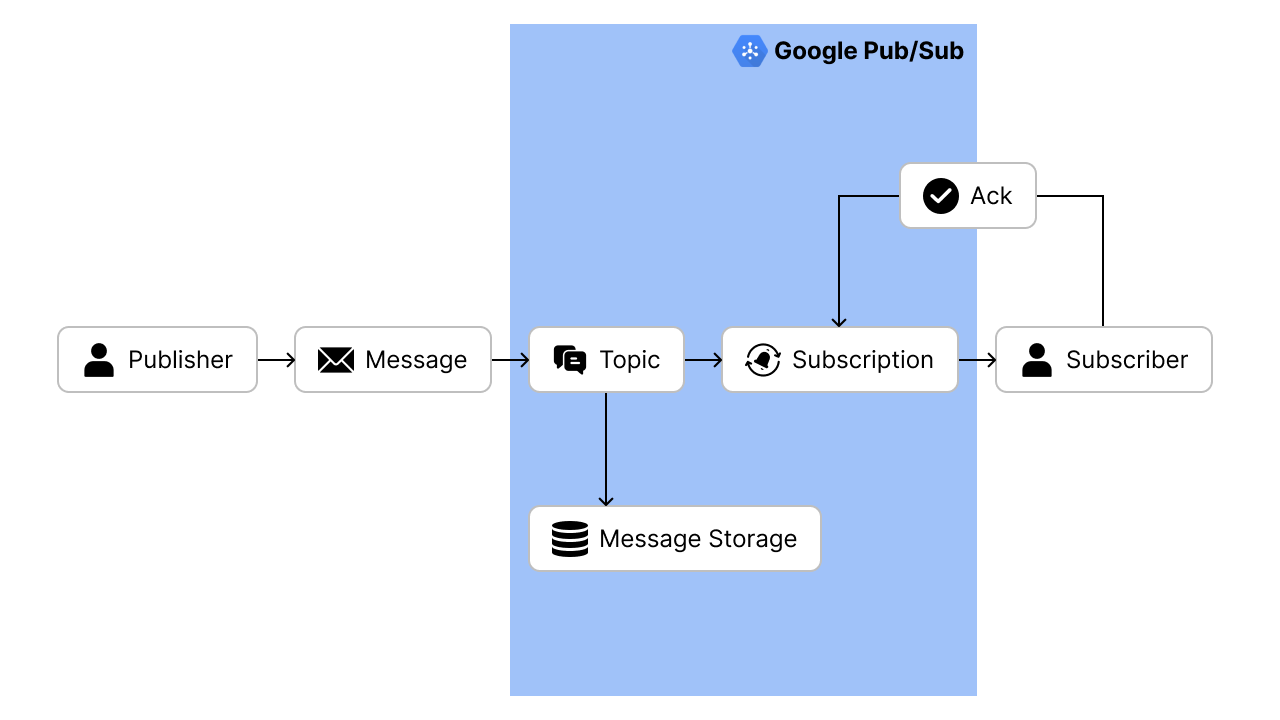
Following the steps mentioned in the setup section, we will start by integrating the sensors with Google Pub/Sub. Pub/Sub is essentially a global messaging service which can be used for distributing event data across multiple applications and services asynchronously. The message delivery model is very simple:
- A publisher (application that creates and sends a message) creates a Topic (a named resource that allows applications to connect with one another through a common thread), while subscribers (application that will receive the message) creates a subscription. Only messages published to the topic after the subscription is created are available to subscribers.
- The publisher sends a message consisting of data and other optional attributes to the created topic. Pub/Sub will ensure that the messages will be retained until it is acknowledged by the subscribers.
- Pub/Sub forwards the message individually to all of the topic's subscriptions.
- A subscriber receives the message by pulling it directly from Pub/Sub (pull model) or by having Pub/Sub sends the message to the registered HTTP endpoint (push model).
- Subscriber sends an acknowledgment to Pub/Sub for each received message. Acknowledgment is sent to notify Pub/Sub that the subscriber has successfully received the message.
- Pub/Sub removes acknowledged messages from the subscription's message queue.
Having understood how Pub/Sub delivers messages, let's integrate it with our sensor simulation. Navigate to Pub/Sub and click on Create Topic. Provide inventory-streaming for the Topic ID and leave everything as is (if you want to use a name of your choice for the Topic ID, make sure to change the _topic variable in the Python script). By leaving the other options as default, Pub/Sub automatically creates a default subscription for the topic, having the subscription ID of <topic_id>-sub.
With our Pub/Sub all set, we can immediately start our sensor simulation. Activate your virtual environment execute the following command
The --speedMultiplier argument determines how many minutes of data will be sent in 1 minute. For example, if you set the speed multiplier to 2, the script will send 2 minutes worth of data in 1 minute real-time by shortening the sleep duration from 60 seconds to 30 seconds.
Building a Dataflow Pipeline
Upon integrating our sensor with Pub/Sub, our next goal would be to create a pipeline that transfers the data into BigQuery, the default data warehouse solution in Google Cloud Platform. Why BigQuery? Why not any other place such as Cloud Storage? The result of our pipeline would be clean, processed data ready to be immediately shared across all of our applications. Hence, we would want to store them in a storage optimized for simplicity of access and high-speed data retrieval. BigQuery fulfills those requirements, on top of being integrated with other data processing tools.
Read more about BigQuery in our previous article that demonstrated how to create a modern and optimized data warehouse with BigQuery!
At this point, we have defined our input (Pub/Sub message) and output (BigQuery table), but we have yet to build a connector that can process and transform our input into the designated output. In Google Cloud Platform, the preferred way to do streaming data processing is by using Dataflow. Remember that if you need to process a large amount of streaming data, you will find that using serverless service is the easiest choice — you do not want to manage the whole architecture by yourself, let alone configuring the pipeline to be highly scalable with low latency.
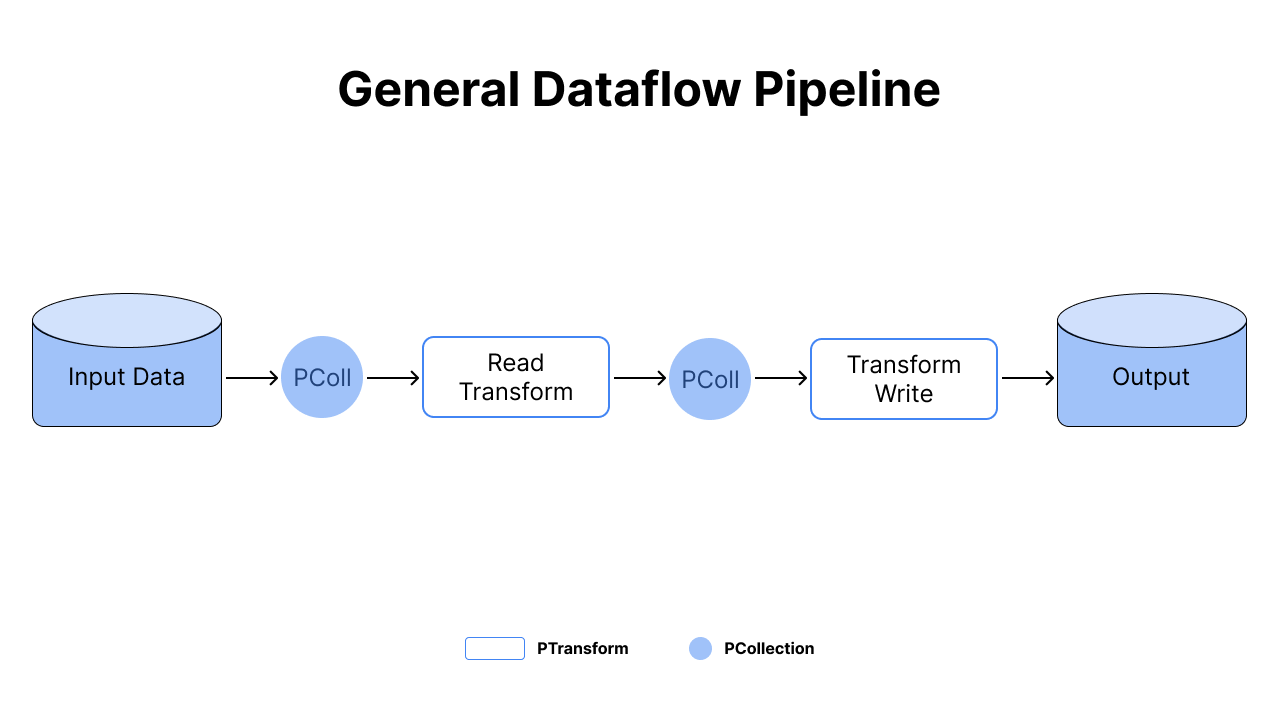
Dataflow is based on Apache Beam, which unifies traditional batch programming and data processing concepts. You can use it to process data both in batch or streaming mode using the same code! So how does it work? Before using Beam, keep in mind that there are 4 fundamental concepts:
- Pipeline: a directed graph that represents the entire data processing tasks
- PCollection: a distributed data abstraction that can be regarded as dataset in the pipeline
- PTransforms: a processing operation that handles one or more PCollections and produces zero or more PCollections
- Pipeline Runners: the container that hosts the pipeline
In short, the input data and PCollection is passed along the pipeline graph from one PTransform to another.
Coding the Dataflow Pipeline in Python
Without further ado, let's code our pipeline that reads the data from a Pub/Sub subscription and write it into BigQuery. If you are already familiar with Dataflow, you should have known that Dataflow provides numerous templates ready to be used. These templates are written in Java and their source code can be found on Google Cloud Platform GitHub, including the one that we will make. However, the current template only allows us to write into BigQuery given that we send the data into Pub/Sub in JSON format. Hence, we will see how to recreate and modify the underlying code in Python.
Make sure that you have installed the required libraries from requirements.txt and activate your virtual environment before attempting to run this code
Create a .py file or .ipynb file in your working directory and connect it into your Google Cloud project.
For now we will only read the message from Pub/Sub subscription and simply print them. Reading from Pub/Sub requires us to set our pipeline in streaming mode, which can be done by passing --streaming argument into the Pipeline Options. Pipeline Options is essentially an object in which you can specify the configuration of your pipeline, such as the pipeline runner, output location, etc.
With the options already specified, we can directly create our pipeline. We can use context managers (with statement) to create and start our pipeline while passing the options created prior as a parameter. Don't forget to change <project_name> and <subscription_name>!
Notice that we created a PCollection by taking the pipeline object p and passing it over to read the messages from Pub/Sub. The pipe operator | means that we are invoking Beam transformation (this is similar to method chaining), passing the PCollection into a PTransform. In this code, our PTransform is mapping the data read from Pub/Sub into a print function, which will result in the pipeline printing a single element for every input element in the PCollection obtained by reading from Pub/Sub. The result of the previous code should look as follows
We see that the messages are in bytes instead of string format. To write into BigQuery, we will need to transform our data into JSON format, with column names as keys and the data itself as values. Let's first define our processing function that converts these bytes data into JSON.
Here we define our custom class BytesParse which inherits from beam.DoFn object, which is what defines our pipeline's exact data processing task. You need to define the actual processing logic inside the process method, which accepts element as an input and return an iterable with its output values (hence the need to wrap the result in a list). Upon creating our processing logic, we can use ParDo (Beam Transformation for parallel processing) to apply this logic on each element in the input PCollection!
Behind the scenes, our script actually pulls the messages from the Pub/Sub subscription and automatically acknowledges it. The full code for reading from Pub/Sub subscription into BigQuery can be seen in the dataflow_pubsub_to_bq.py file. With the same concepts applied, you should understand what the script does, since the only difference lies in setting up command line parameters.
Deploying the Custom Pipeline
Before we deploy our pipeline, we need to create an output table in BigQuery. Under the Explorer pane in BigQuery, create a dataset and a table with the following schema. Feel free to use any name you prefer for the dataset and table.
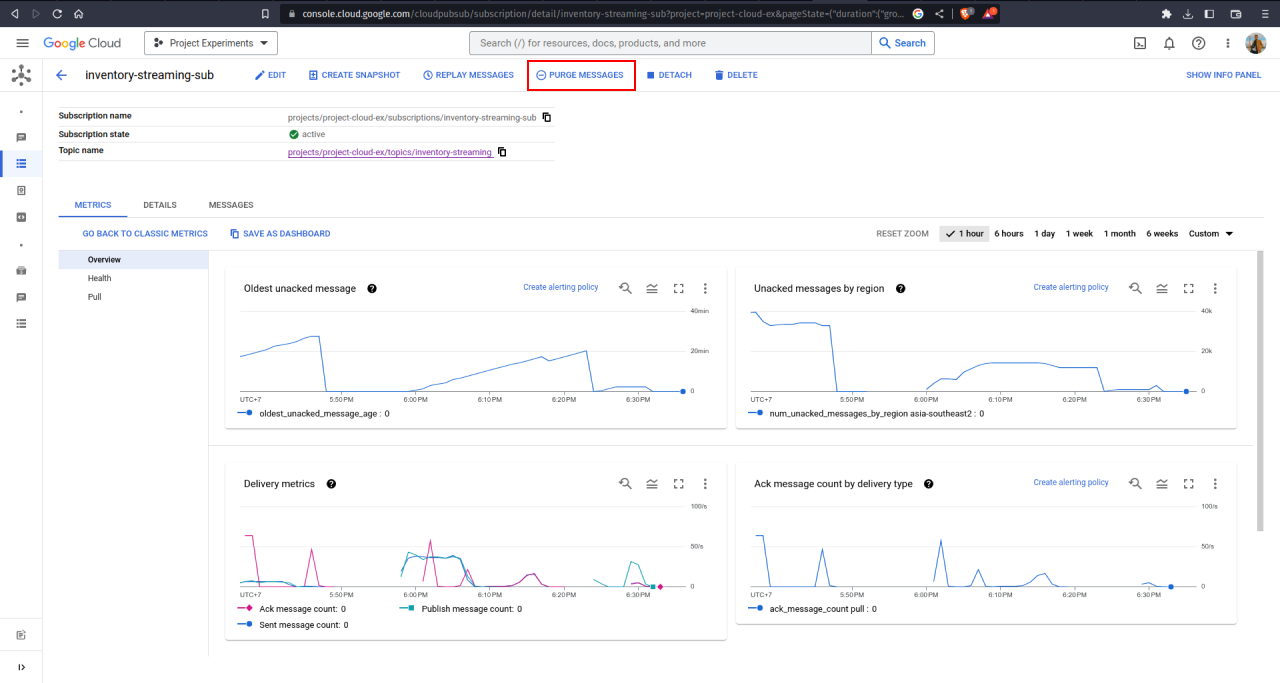
Now we have made all the necessary preparations to deploy our pipeline into Google Cloud Platform. Before we deploy the pipeline, recall that our sensor simulation is sending 1 month worth of data into Pub/Sub, which means that populating the BigQuery table would take some time to finish. Therefore, we will now restart our sensor and pass a high speed multiplier into it. But our Pub/Sub has already retained some data from the previous sensor! Duplicated value is something we would want to avoid. Fortunately, Pub/Sub offers Purge Message option, which you can use by accessing Pub/Sub > Subscriptions. Go ahead and purge the messages in your Pub/Sub!
Upon purging the message, we can deploy the Dataflow pipeline (it takes some time to finish deploying the pipeline). Modify the arguments on the following command and execute them on your terminal to create a custom dataflow job. The arguments that you need to modify are those except runner, num_workers, and max_num_workers
Once you get the message notifying all workers have finished the startup processes and began to receive work requests, you can re-run the sensor so that the data will be sent faster using the following command in another terminal.
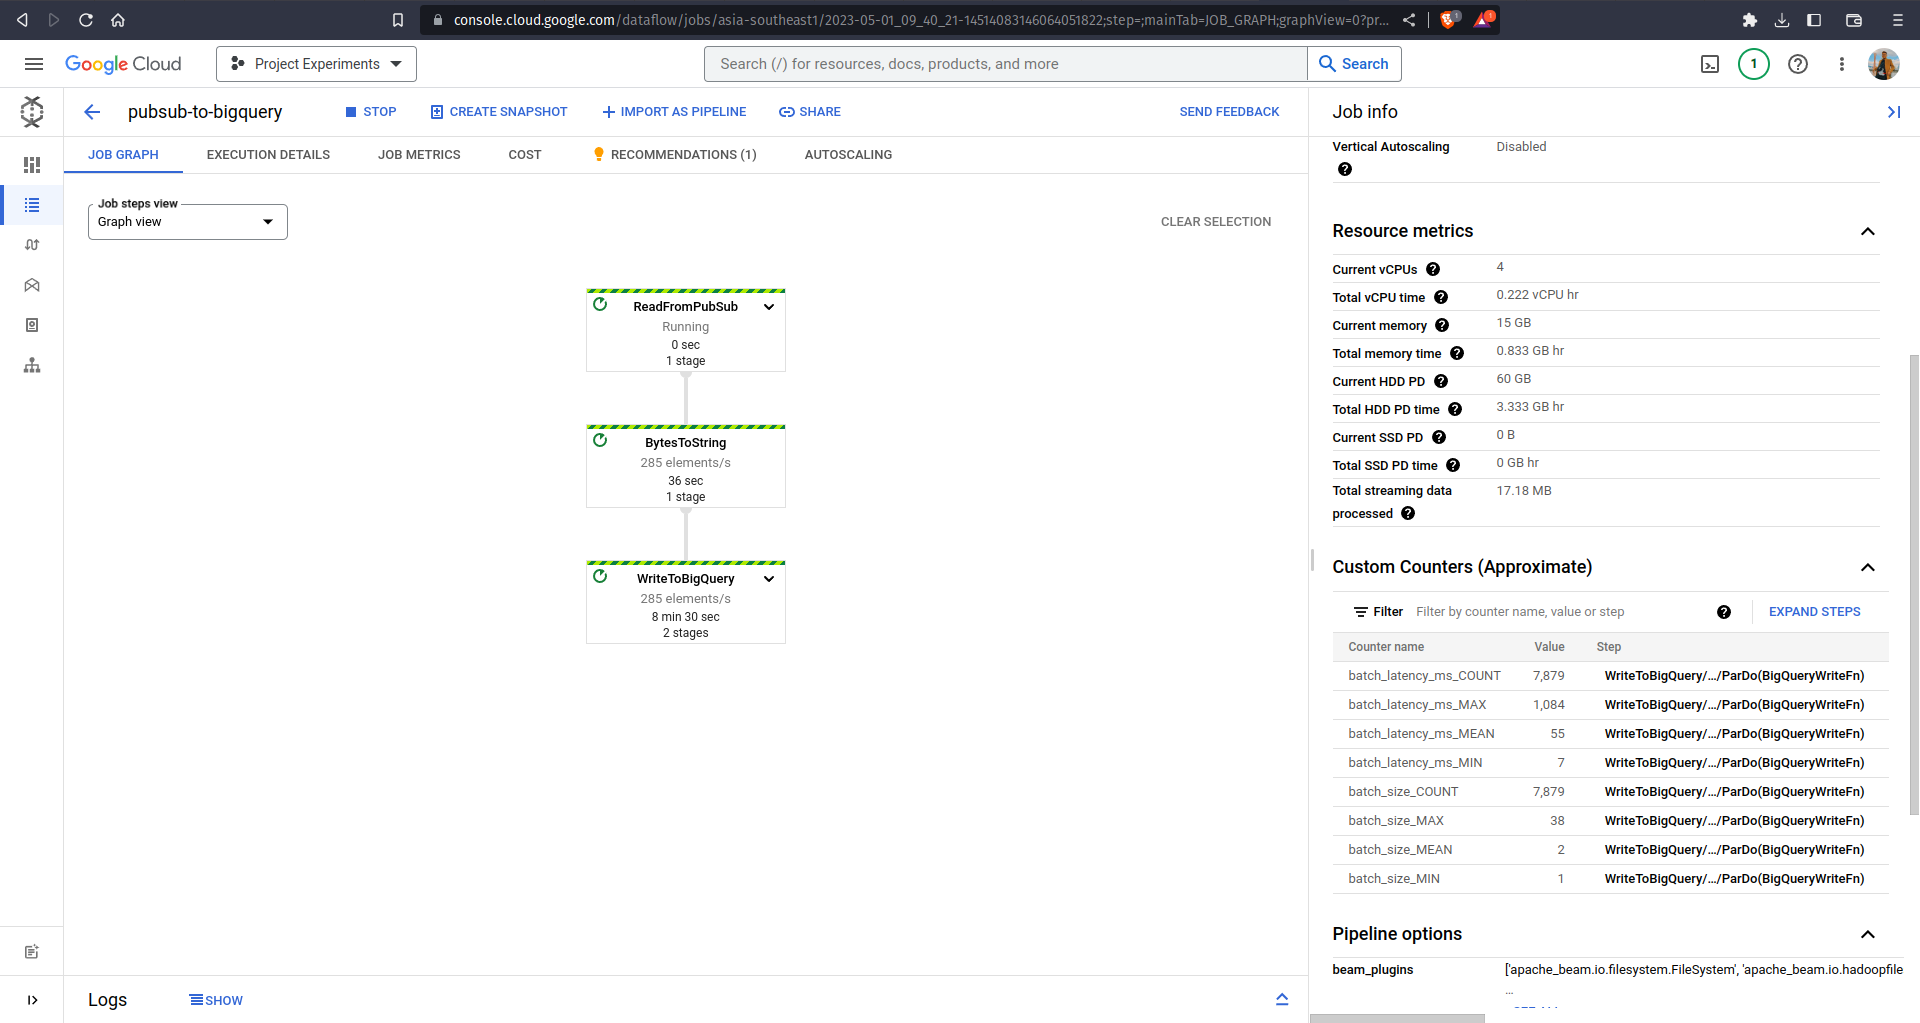
Remember that pipeline is represented as a directed graph in Dataflow? Try navigating to Dataflow Jobs and inspect the graph yourself! It monitors the pipeline execution details, how many elements are processed every second in every PTransform, and so on. The graph also shows the high throughput of Dataflow — it is able to ingest more than 250 rows/second into BigQuery even when we were applying custom parsing to it!
On the other hand, navigate to your BigQuery and see your table being populated over time. It took me 10 minutes to ingest more than 50.000 rows!
Stopping the sensor simulation will definitely stop our script from publishing data into Pub/Sub. However, stopping the Dataflow script in the terminal will not stop our Dataflow pipeline from processing the data. This is because we deployed our custom pipeline into Google Cloud Platform, where some cloud resources were allocated to run our streaming pipeline job. If you want to stop the pipeline later on as to not incur additional costs, simply navigate to the running Dataflow job and click on the Stop button.
What's Next?
This article mainly focuses on how to use Pub/Sub and Dataflow to ingest data that was sent by sensors into the designated data warehouse. As a few endnotes (and a guide to your learning journey), I suggest you explore more about Dataflow and Apache Beam. Try to enhance the pipeline we created prior using more advanced concepts!
Last but not least, our data in the data warehouse can only be consumed by anyone who has an experience in using a data warehouse, but not end-users in general. Try to make a product out of the ingested data, e.g. a real-time inventory management dashboard. Remember that one of the reasons why BigQuery is considered the best data warehouse available in the market is because it has a seamless integration with multiple data processing tools, one of them being Looker Studio for generating reports and dashboards. I'm looking forward to what product you will build upon reading this article! ❤️
Read More
Using Airflow and YouTube API to Automatically Retrieve Trending Videos
This article explains how to set up a workflow using Apache Airflow to retrieve trending videos data from YouTube Data API v3 and store them in BigQuery.
Django REST + custom permissions + Talend API / Postman = ❤️
Django REST Framework + testing your custom permissions in an API application with Talend API Tester or Postman
Introduction to Apache Airflow
Everything you need to know to get started using Apache Airflow
Redis for API Caching
Build a simple API using Django Rest Framework, and use Redis for caching.
Tags: Data Engineering, Pub/Sub, Data Warehouse, Dataflow, BigQuery